Punnets vs Property
The 139th Wimbledon Championships are underway at the All England Club, welcoming 128 singles players and 64 doubles teams in each draw ahead of the tournament’s conclusion on Sunday 12 July. Beyond the tennis, attention once again turns to the Championships’ most famous culinary tradition: strawberries and cream.
The fresh strawberries are supplied by Hugh Lowe Farms, which has been serving Wimbledon for more than 25 years. Each portion is topped with thick cream, and demand remains enormous, with more than 190,000 portions expected to be sold during the 14-day tournament, generating around £540,000 in sales.
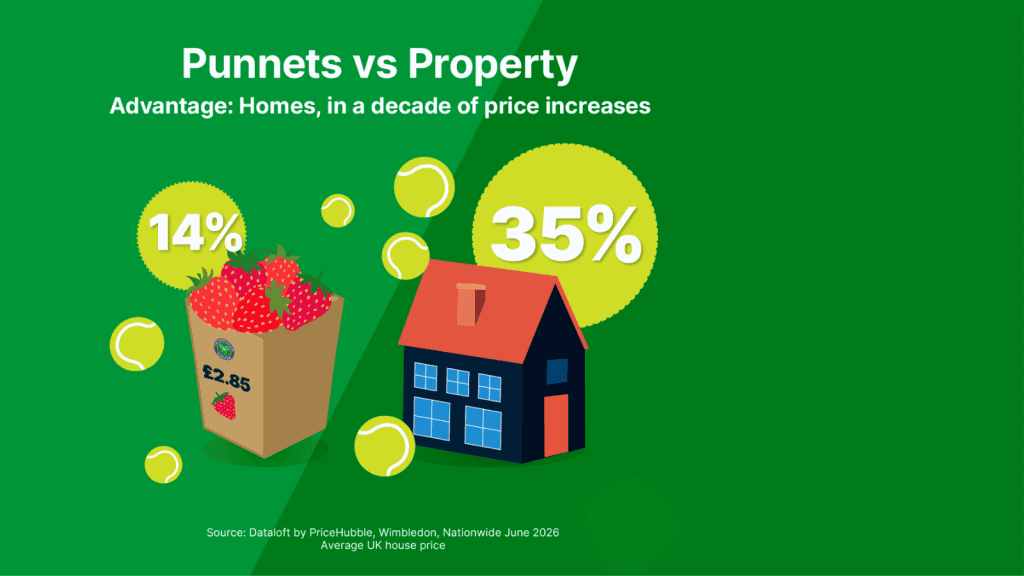
The price of Wimbledon’s iconic strawberries and cream also offers an interesting insight into inflation over the past decade. After remaining at £2.50 for around ten years, the price increased to £2.70 in 2025 and now stands at £2.85 in 2026. This represents a total increase of 14% over the last decade.
By comparison, the average UK house price has risen by around 35% over the same period, more than twice the rate of the increase in the price of strawberries and cream. While the cost of one of Wimbledon’s most iconic traditions has remained relatively stable, the housing market has experienced significantly stronger price growth over the past ten years.
Punnets vs Property Read More »